Note
Go to the end to download the full example code.
07: Exploring the Model Object
Further exploring the SpectralModel object, including algorithm settings and available methods.
# Import the model object
from specparam import SpectralModel

# Import utility to download and load example data
from specparam.demo import load_example_data
# Initialize a model object
fm = SpectralModel()
Description of methods and attributes
The SpectralModel object contents consist of 4 main components
(groups of data / code):
settings attributes, that control the algorithm fitting
data attributes, that contain and describe the data
result attributes, that contain the resulting parameters that describe the model fit
methods (functions) that perform procedures for fitting models and associated utilities
Each these which are described in more detail below.
The specparam module follows the following Python conventions:
all user exposed settings, data, and methods are directly accessible through the object
‘hidden’ (internal) settings and methods have a leading underscore
you can access these if you need to, but one should be cautious doing so
1) Settings (attributes)
There are a number of settings that control the fitting algorithm, that
can be set by the user when initializing the SpectralModel object.
There are some internal settings that are not exposed at initialization. These settings are unlikely to need to be accessed by the user, but can be if desired - they are all defined and documented in the code in the object’s __init__ (there are no other settings, or ‘magic numbers’ in any other parts of the code).
Controlling Peak Fits
peak_width_limits (Hz) default: [0.5, 12]
Enforced limits on the minimum and maximum widths of extracted peaks, given as a list of [minimum bandwidth, maximum bandwidth]. We recommend that the minimum bandwidth be set to be at last twice the frequency resolution of the power spectrum, so that single points can not be fit as peaks.
Peak Search Stopping Criteria
An iterative procedure searches for candidate peaks in the flattened spectrum. Candidate peaks are extracted in order of decreasing height, until some stopping criterion is met, which is controlled by the following settings:
max_n_peaks (int) default: infinite
The maximum number of peaks that can be extracted from a given power spectrum. The algorithm will halt searching for new peaks when this number is reached. Note that peaks are extracted iteratively by height (over and above the aperiodic component), and so this approach will extract (up to) the n largest peaks.
peak_threshold (relative threshold - standard deviation of power spectrum) default: 2.0
The threshold, in terms of standard deviation of the aperiodic-removed power spectrum, above which a data point must pass to be considered a candidate peak. Once a candidate peak drops below this threshold, the peak search is halted (without including the most recent candidate).
min_peak_height (absolute threshold - units of log power) default: 0
The minimum height, above the aperiodic fit, that a peak must have to be extracted in the initial fit stage. This threshold is defined in units of log power. Once a candidate peak drops below this threshold, the peak search is halted (without including the most recent candidate). Note that because this constraint is enforced during peak search, and prior to final peak fit, returned peaks are not guaranteed to surpass this value in height.
There are two different height-related halting conditions for the peak searching. By default, the relative (standard-deviation based) threshold is defined, whereas the absolute threshold is set to zero (this default is because there is no general way to set this value without knowing the scale of the data). If both are defined, both are used and the peak search will halt when a candidate peak fails to pass either the absolute, or relative threshold.
Verbosity
verbose (boolean) default=’True’
Whether to print out status updates and warnings.
# You can check all the user defined settings by printing from the model object
fm.print('settings')
==================================================================================================

                                            ALGORITHM
                                           spectral_fit

                                        ALGORITHM SETTINGS
                                 peak_width_limits : (0.5, 12.0)
                                        max_n_peaks : inf
                                      min_peak_height : 0.0
                                       peak_threshold : 2.0

==================================================================================================
Changing Settings
Note that if you wish to change settings, then you should re-initialize
a new SpectralModel object with new settings.
Simply changing the value of the relevant attribute may not appropriately propagate the value, and thus may lead to a failure, either creating an error, or not applying the settings properly during fit and returning erroneous results.
Here we will re-initialize a new SpectralModel object, with some new settings.
# Re-initialize a new model object, with some new specified settings
fm = SpectralModel(peak_width_limits=[1, 8], max_n_peaks=6, min_peak_height=0.15)
2) Data (attributes)
The SpectralModel object stores the following data attributes:
freqs: the frequency values of the power spectrumpower_spectrum: the power values of the power spectrumfreq_range: the frequency range of the datafreq_res: the frequency resolution of the data
Note that these are all stored in a data object that is stored as a component of the
overall model object (SpectralModel.data).
During the fit procedure, interim (hidden) data variables are also created and used.
# Load example data files needed for this example
freqs = load_example_data('freqs_2.npy', folder='data')
spectrum = load_example_data('spectrum_2.npy', folder='data')
# Set a frequency range and add the data to the object
freq_range = [2, 40]
fm.add_data(freqs, spectrum, freq_range)
Frequency Range:         [np.float64(2.441406250001353), np.float64(39.55078125002192)]
Frequency Resolution:    0.48828125000027045
Frequency Values:        [2.44140625 2.9296875  3.41796875 3.90625    4.39453125]
Power Values:            [-21.99921865 -21.99669556 -22.02605736 -21.96875308 -22.15436702]
There is also an indicator attribute, has_data which indicates
if the current object has data loaded.
# Check if the object has data loaded
print('Has data loaded: ', fm.data.has_data)
Has data loaded: True
Now that we have picked our settings, and added the data, let’s fit a power spectrum model.
# Fit a power spectrum model to the loaded data
fm.fit()
3) Results (attributes)
With our model fit, the results attributes should now hold values.
Recall that by convention, any attributes that contain model results are indicated by a trailing underscore.
The model parameter results stored by the object include:
aperiodic_params: a list of aperiodic parameters, stored as [Offset, (Knee), Exponent]peak_params: all periodic parameters, where each row is a peak, as [CF, PW, BW]
The model object also computes and stores metrics to assess the model:
gof: goodness of fit measures of the model, as compared to the original dataerror: the error measures of the model, as compared to the original data
Note that these are all stored in a results object that is stored as a component of the
overall model object (SpectralModel.results).
# Print out model fit results parameters
print('aperiodic params: \t', fm.results.params.aperiodic.params)
print('peak params: \t', fm.results.params.periodic.params)

# Print out metrics model fit results parameters
print('fit error: \t', fm.results.metrics.results['error_mae'])
print('r-squared: \t', fm.results.metrics.results['gof_rsquared'])
aperiodic params:        [-21.44373534   1.07510111]
peak params:     [[ 9.81640201  0.72771296  3.00583442]
 [13.04631968  0.2596321   2.5372395 ]
 [18.12686018  0.15093619  4.62823414]]
fit error:       0.02937151526182348
r-squared:       0.9922996524962877
The SpectralModel object also has an indicator attribute, has_model
which indicates if the current object has model results available.
# Check if the object has model results
print('Has model results: ', fm.results.has_model)
Has model results: True
4) Methods
The SpectralModel object contains a number of methods that are either used
to fit models and access data, and/or offer extra functionality.
In addition to the exposed methods, there are some internal private methods, with a leading underscore in their name, that are called in the fitting procedure. These methods should not be called directly by the user as they may depend on internal state of the object as defined by other methods, and so may not do as expected in isolation.
# This piece of code is just a way to print out all the public methods with their description
[print(it + '\n\t' + eval('fm.' + it + '.__doc__').split('\n')[0]) \
    for it in dir(fm) if it[0] != '_' and callable(eval('fm.' + it))];
add_data
Add data (frequencies, and power spectrum values) to the current object.
add_modes
Add modes definition to the object.
copy
Return a copy of the current object.
fit
Fit a power spectrum as a combination of periodic and aperiodic components.
get_metrics
Get requested metric(s) from the object.
get_params
Return model fit parameters for specified feature(s).
load
Load in a data file to the current object.
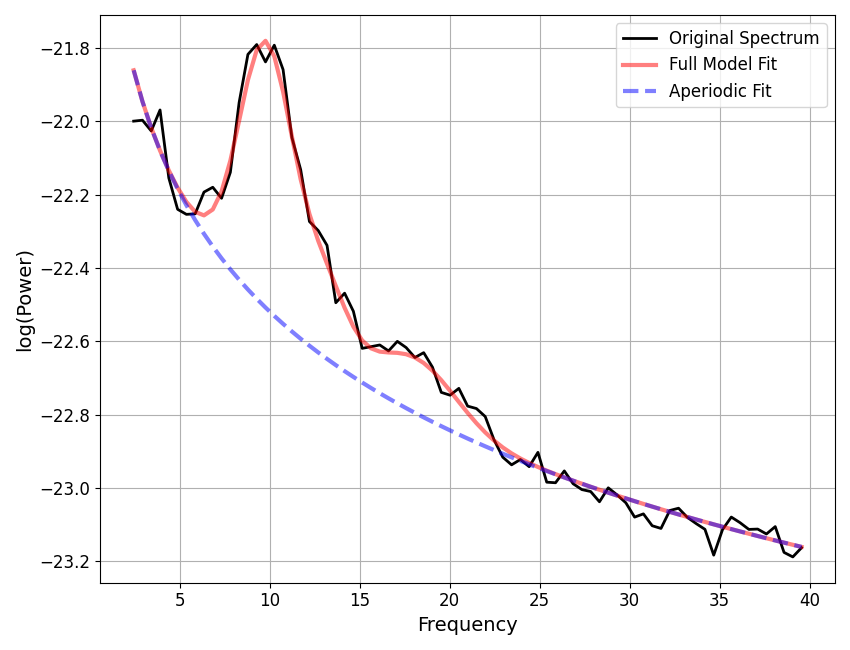
plot
Plot the power spectrum and model fit results from a model object.
print
Print out information.
report
Run model fit, and display a report, which includes a plot, and printed results.
save
Save out data, results and/or settings from a model object into a JSON file.
save_report
Generate and save out a PDF report for a power spectrum model fit.
to_df
Convert and extract the model results as a pandas object.
[None, None, None, None, None, None, None, None, None, None, None, None, None]
Saving Data & Results
There is also functionality for saving out, and loading back in, data and results.
You have the option to specify which data to save.
results: model fit results (same as is returned in FitResults)
settings: all public settings (everything available at initialization)
data: freqs & power spectrum
Selected items are saved out to JSON files. You can specify a file name to save or append to, or pass in a JSON file object.
# Save out results, settings, and data
fm.save('results', save_results=True, save_settings=True, save_data=True)
# Load back in the saved out information
nfm = SpectralModel()
nfm.load('results')
# Plot loaded results
nfm.plot()
Creating Reports
There is also functionality to save out a ‘report’ of a particular model fit.
This generates and saves a PDF which contains the same output as
print('results')(),
plot(), and
print('settings')().
# Save out a report of the current model fit & results
fm.save_report('report')
/Users/tom/miniconda3/envs/sphinx/lib/python3.13/site-packages/specparam/reports/save.py:63: UserWarning: This figure includes Axes that are not compatible with tight_layout, so results might be incorrect.
  plt.savefig(create_file_path(file_name, file_path, SAVE_FORMAT))
/Users/tom/miniconda3/envs/sphinx/lib/python3.13/site-packages/specparam/reports/save.py:63: UserWarning: This figure includes Axes that are not compatible with tight_layout, so results might be incorrect.
  plt.savefig(create_file_path(file_name, file_path, SAVE_FORMAT))
Conclusion
We have now fully explored the SpectralModel object, and all it contains.
Next, we will take a deeper dive into how to choose different modes for fitting
the aperiodic component of power spectra.
Total running time of the script: (0 minutes 0.691 seconds)