specparam.SpectralModel
- class specparam.SpectralModel(aperiodic_mode='fixed', periodic_mode='gaussian', algorithm='spectral_fit', algorithm_settings=None, metrics=None, converters=None, bands=None, debug=False, verbose=True, **model_kwargs)[source]
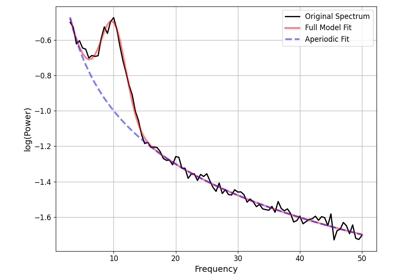
Model a power spectrum as a combination of aperiodic and periodic components.
WARNING: frequency and power values inputs must be in linear space. Passing in logged frequencies and/or power spectra is not detected, and will silently produce incorrect results.
- Parameters:
- peak_width_limitstuple of (float, float), optional, default: (0.5, 12.0)
Limits on possible peak width, in Hz, as (lower_bound, upper_bound).
- max_n_peaksint, optional, default: inf
Maximum number of peaks to fit.
- min_peak_heightfloat, optional, default: 0
Absolute threshold for detecting peaks. This threshold is defined in absolute units of the power spectrum (log power).
- peak_thresholdfloat, optional, default: 2.0
Relative threshold for detecting peaks. Threshold is defined in relative units of the power spectrum (standard deviation).
- aperiodic_mode{‘fixed’, ‘knee’} or Mode
Which approach to take for fitting the aperiodic component.
- periodic_mode{‘gaussian’, ‘skewed_gaussian’, ‘cauchy’} or Mode
Which approach to take for fitting the periodic component.
- algorithm{‘spectral_fit’} or Algorithm
The fitting algorithm to use.
- algorithm_settingsdict
Setting for the algorithm.
- metricsMetrics or list of Metric or list or str
Metrics definition(s) to use to evaluate the model.
- convertersdict
Definition for parameter conversions to apply post fitting.
- bandsBands or dict or int or None, optional
Bands object with band definitions, or definition that can be turned into a Bands object.
- debugbool, optional, default: False
Whether to run in debug mode. If in debug, any errors encountered during fitting will raise an error.
- verbosebool, optional, default: True
Verbosity mode. If True, prints out warnings and general status updates.
- **model_kwargs
Additional model fitting related keyword arguments. These are passed into the algorithm object.
- Attributes:
- algorithmAlgorithm
Algorithm object with model fitting settings and procedures.
- modesModes
Modes object with fit mode definitions.
- dataData
Data object with spectral data and metadata.
- resultsResults
Results object with model fit results and metrics.
Notes
Input power spectra must be provided in linear scale. Internally they are stored in log10 scale, as this is what the model operates upon.
Input power spectra should be smooth, as overly noisy power spectra may lead to bad fits. For example, raw FFT inputs are not appropriate. Where possible and appropriate, use longer time segments for power spectrum calculation to get smoother power spectra, as this will give better model fits.
- __init__(aperiodic_mode='fixed', periodic_mode='gaussian', algorithm='spectral_fit', algorithm_settings=None, metrics=None, converters=None, bands=None, debug=False, verbose=True, **model_kwargs)[source]
Initialize model object.
Methods
__init__([aperiodic_mode, periodic_mode, ...])Initialize model object.
add_data(freqs, power_spectrum[, ...])Add data (frequencies, and power spectrum values) to the current object.
add_modes(aperiodic_mode, periodic_mode)Add modes definition to the object.
copy()Return a copy of the current object.
fit([freqs, power_spectrum, freq_range, ...])Fit a power spectrum as a combination of periodic and aperiodic components.
get_metrics(category[, measure])Get requested metric(s) from the object.
get_params(component[, field])Return model fit parameters for specified feature(s).
load(file_name[, file_path, regenerate])Load in a data file to the current object.
plot([plot_peaks, plot_aperiodic, freqs, ...])Plot the power spectrum and model fit results from a model object.
print([info, concise])Print out information.
report([freqs, power_spectrum, freq_range, ...])Run model fit, and display a report, which includes a plot, and printed results.
save(file_name[, file_path, append, ...])Save out data, results and/or settings from a model object into a JSON file.
save_report(file_name[, file_path, add_settings])Generate and save out a PDF report for a power spectrum model fit.
to_df([bands])Convert and extract the model results as a pandas object.
- add_data(freqs, power_spectrum, freq_range=None, clear_results=True)[source]
Add data (frequencies, and power spectrum values) to the current object.
- Parameters:
- freqs1d array
Frequency values for the power spectrum, in linear space.
- power_spectrum1d array
Power spectrum values, which must be input in linear space.
- freq_rangelist of [float, float], optional
Frequency range to restrict power spectrum to. If not provided, keeps the entire range.
- clear_resultsbool, optional, default: True
Whether to clear prior results, if any are present in the object. This should only be set to False if data for the current results are being re-added.
Notes
If called on an object with existing data it will be cleared by this method call.
- add_modes(aperiodic_mode, periodic_mode)
Add modes definition to the object.
- Parameters:
- aperiodic_modeMode or str
Mode for aperiodic component, or string specifying which mode to use.
- periodic_modeMode or str
Mode for periodic component, or string specifying which mode to use.
- copy()
Return a copy of the current object.
- fit(freqs=None, power_spectrum=None, freq_range=None, prechecks=True)[source]
Fit a power spectrum as a combination of periodic and aperiodic components.
- Parameters:
- freqs1d array, optional
Frequency values for the power spectrum, in linear space.
- power_spectrum1d array, optional
Power values, which must be input in linear space.
- freq_rangelist of [float, float], optional
Frequency range to restrict power spectrum to. If not provided, keeps the entire range.
- prechecksbool, optional, default: True
Whether to run model fitting pre-checks.
- Raises:
- NoDataError
If no data is available to fit.
- FitError
If model fitting fails to fit. Only raised in debug mode.
Notes
Data is optional, if data has already been added to the object.
- get_metrics(category, measure=None)[source]
Get requested metric(s) from the object.
- Parameters:
- categorystr
Category of metric to extract, e.g. ‘error’ or ‘gof’. If ‘all’, returns all available metrics.
- measurestr, optional
Name of the specific measure(s) to return.
- Returns:
- metricsdict
Dictionary of requested metrics.
- get_params(component, field=None)[source]
Return model fit parameters for specified feature(s).
- Parameters:
- component{‘aperiodic’, ‘periodic’}
Name of the component to extract parameters for.
- fieldstr or int, optional
Column name / index to extract from selected data, if requested. If str, should align with a parameter label for the component fit mode.
- version{‘fit’, ‘converted’}
Which version of the parameters to extract.
- Returns:
- outfloat or 1d array
Requested data.
- Raises:
- NoModelError
If there are no model fit parameters available to return.
Notes
If there are no fit peaks (no periodic parameters), this method will return NaN.
- load(file_name, file_path=None, regenerate=True)[source]
Load in a data file to the current object.
- Parameters:
- file_namestr or FileObject
File to load data from.
- file_pathPath or str, optional
Path to directory to load from. If None, loads from current directory.
- regeneratebool, optional, default: True
Whether to regenerate the model fit from the loaded data, if data is available.
- plot(plot_peaks=None, plot_aperiodic=True, freqs=None, power_spectrum=None, freq_range=None, plt_log=False, add_legend=True, ax=None, data_kwargs=None, model_kwargs=None, aperiodic_kwargs=None, peak_kwargs=None, **plot_kwargs)[source]
Plot the power spectrum and model fit results from a model object.
- Parameters:
- plot_peaksNone or {‘shade’, ‘dot’, ‘outline’, ‘line’}, optional
What kind of approach to take to plot peaks. If None, peaks are not specifically plotted. Can also be a combination of approaches, separated by ‘-’, for example: ‘shade-line’.
- plot_aperiodicboolean, optional, default: True
Whether to plot the aperiodic component of the model fit.
- freqs1d array, optional
Frequency values of the power spectrum to plot, in linear space. If provided, this overrides the values in the model object.
- power_spectrum1d array, optional
Power values to plot, in linear space. If provided, this overrides the values in the model object.
- freq_rangelist of [float, float], optional
Frequency range to plot, defined in linear space.
- plt_logboolean, optional, default: False
Whether to plot the frequency values in log10 spacing.
- add_legendboolean, optional, default: False
Whether to add a legend describing the plot components.
- axmatplotlib.Axes, optional
Figure axes upon which to plot.
- data_kwargs, model_kwargs, aperiodic_kwargs, peak_kwargsNone or dict, optional
Keyword arguments to pass into the plot call for each plot element.
- **plot_kwargs
Additional plot related keyword arguments, with styling options managed by
style_plot.
Notes
The y-axis (power) is plotted in log spacing by default.
- print(info='results', concise=False)[source]
Print out information.
- Parameters:
- info{‘results’, ‘algorithm’, ‘settings’, ‘data’, ‘modes’, ‘metrics’, ‘bands’, ‘issue’}
- Which information to print:
‘results’ : print information on the fit results ‘algorithm’ or ‘settings: print information on the fit algorithm & settings ‘data’ : print information on the data ‘modes’ : print information on the fit modes ‘metrics’ : print information on the defined fit metrics ‘bands’ : print information on any defined frequency bands ‘issue’ : print instructions on how to report bugs and/or problematic fits
- concisebool, optional, default: False
Whether to print a concise version of the report.
- report(freqs=None, power_spectrum=None, freq_range=None, plt_log=False, plot_full_range=False, **plot_kwargs)[source]
Run model fit, and display a report, which includes a plot, and printed results.
- Parameters:
- freqs1d array, optional
Frequency values for the power spectrum.
- power_spectrum1d array, optional
Power values, which must be input in linear space.
- freq_rangelist of [float, float], optional
Frequency range to fit the model to. If not provided, fits across the entire given range.
- plt_logbool, optional, default: False
Whether or not to plot the frequency axis in log space.
- plot_full_rangebool, default: False
If True, plots the full range of the given power spectrum. Only relevant / effective if freqs and power_spectrum passed in in this call.
- **plot_kwargs
Keyword arguments to pass into the plot method. Plot options with a name conflict be passed by pre-pending ‘plot_’. e.g. freqs, power_spectrum and freq_range.
Notes
Data is optional, if data has already been added to the object.
- save(file_name, file_path=None, append=False, save_results=False, save_settings=False, save_data=False)[source]
Save out data, results and/or settings from a model object into a JSON file.
- Parameters:
- file_namestr or FileObject
File to save data to.
- file_pathPath or str, optional
Path to directory to save to. If None, saves to current directory.
- appendbool, optional, default: False
Whether to append to an existing file, if available. This option is only valid (and only used) if ‘file_name’ is a str.
- save_resultsbool, optional
Whether to save out model fit results.
- save_settingsbool, optional
Whether to save out settings.
- save_databool, optional
Whether to save out input data.
- save_basebool, optional
Whether to save out base data. Can be set to False to remove redundant information when saving from multiple models.
- Raises:
- ValueError
If the save file is not understood.
- save_report(file_name, file_path=None, add_settings=True, **plot_kwargs)[source]
Generate and save out a PDF report for a power spectrum model fit.
- Parameters:
- file_namestr
Name to give the saved out file.
- file_pathPath or str, optional
Path to directory to save to. If None, saves to current directory.
- add_settingsbool, optional, default: True
Whether to add a print out of the model settings to the end of the report.
- plot_kwargskeyword arguments
Keyword arguments to pass into the plot method.
- to_df(bands=None)[source]
Convert and extract the model results as a pandas object.
- Parameters:
- bandsBands or int, optional
How to organize peaks into bands. If Bands, extracts peaks based on band definitions. If int, extracts the first n peaks. If not provided, uses the bands definition available in the object.
- Returns:
- pd.Series
Model results organized into a pandas object.